Linux Desktop Market Share skyrocketing 500%?
The topic of Linux market share on the desktop is and has been widely contested, but the Windows 10 EOL and Windows 11 issues, spurred many Windows users to migrate to Linux or Mac. But these numbers are difficult to come by. Big Tech has an incentive to suppress any real data on Linux adoption. So how do we know what the real adoption is? Well, I don’t have the answer to that, but I do have some info that I stumbled across and that sparked an idea on how we can find out.
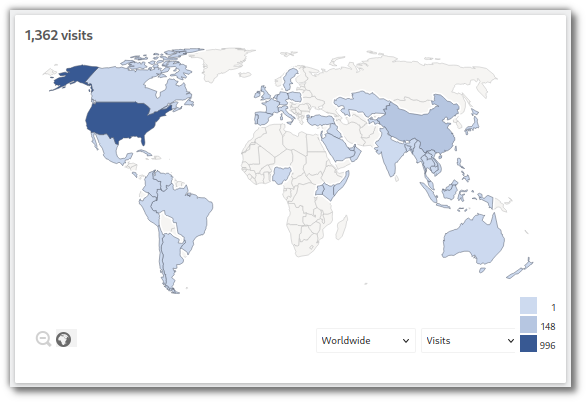
I host a website for a client, a site that I realized is a great microcosm of average desktop/phone users. I will not mention the site name directly, but we will use LRM.net, an acronym for the site. What makes this site unique in regards to the question at hand is that it is a Catholic based site, where Catholics around the world can look up the nearest church to them. The Catholic Church is not bound by ethnicity or borders , so the users are as diverse as you can possibly imaging.
This scenario is perfect for looking at “what are regular users using”, for instance this site (delinuxco.com) is not a good gauge, because you would expect it to be mostly Linux users. So the graph below shows that from November 2025 on, visitors running Linux rose by 500%+ ? The site averages approximately 1400 unique visitors every month with about 2200 page views.
I would like to encourage anyone who hosts websites to check your analytics, do you also see this as well? What are your thoughts?
-John
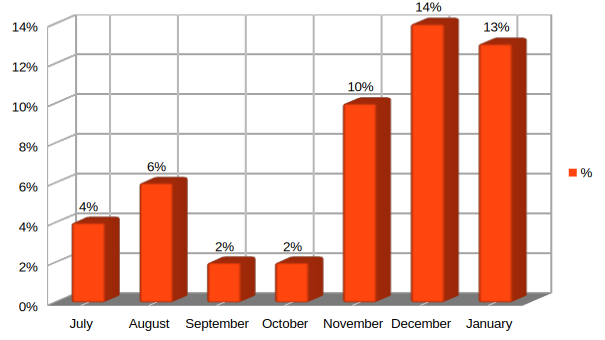
January 2025 – Incomplete @ 13%
| Label | Visits | Actions | Unique visitors |
| iOS | 265 | 437 | 249 |
| Android | 99 | 195 | 94 |
| Windows | 91 | 256 | 88 |
| GNU/Linux | 74 | 91 | 73 |
| Mac | 52 | 112 | 50 |
| Chrome OS | 1 | 5 | 1 |

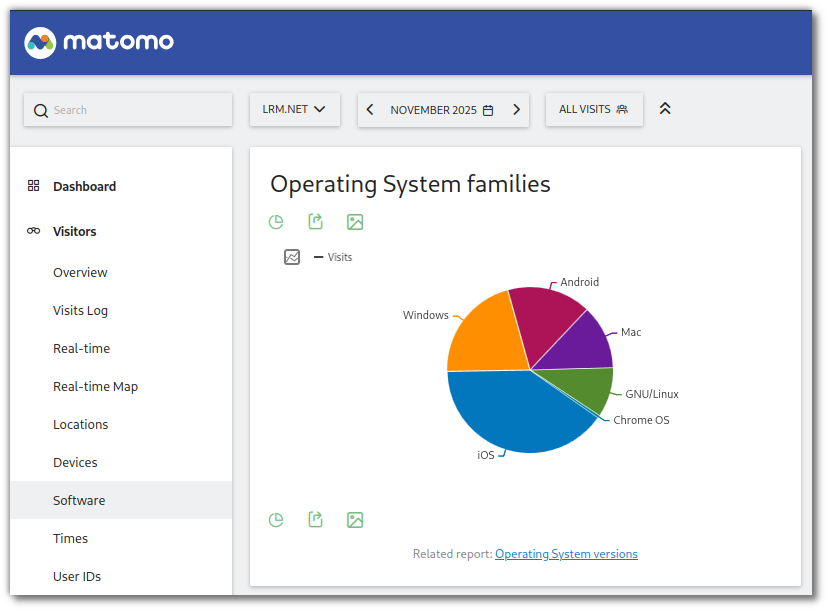
December 2025 – 14%
| Label | Visits | Actions | Unique visitors |
| iOS 18.6 | 206 | 378 | 191 |
| GNU/Linux | 186 | 192 | 186 |
| iOS 18.7 | 178 | 347 | 169 |
| Windows 10 | 158 | 272 | 157 |
| Windows 11 | 118 | 277 | 115 |
| Others | 516 | 997 | 501 |

November 2025 – 10%
| Label | Visits | Actions | Unique visitors |
| iOS 18.6 | 336 | 571 | 300 |
| Windows 10 | 158 | 245 | 155 |
| GNU/Linux | 130 | 157 | 130 |
| Mac 10.15 | 124 | 295 | 117 |
| Windows 11 | 117 | 338 | 112 |
| Others | 492 | 1102 | 459 |
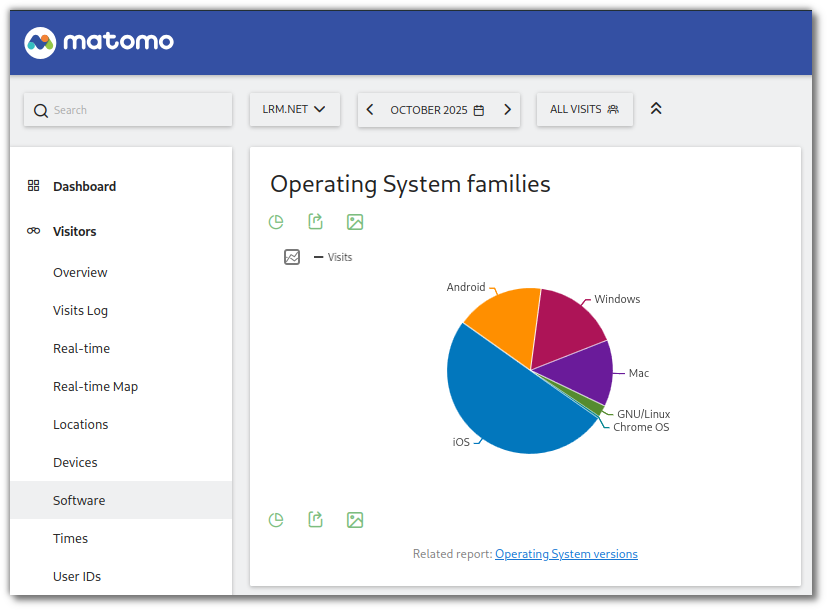
October 2025 – 2%
| Label | Visits | Actions | Unique visitors |
| iOS | 732 | 1266 | 655 |
| Android | 252 | 464 | 242 |
| Windows | 248 | 499 | 243 |
| Mac | 191 | 357 | 179 |
| GNU/Linux | 33 | 38 | 33 |
| Chrome OS | 5 | 8 | 4 |
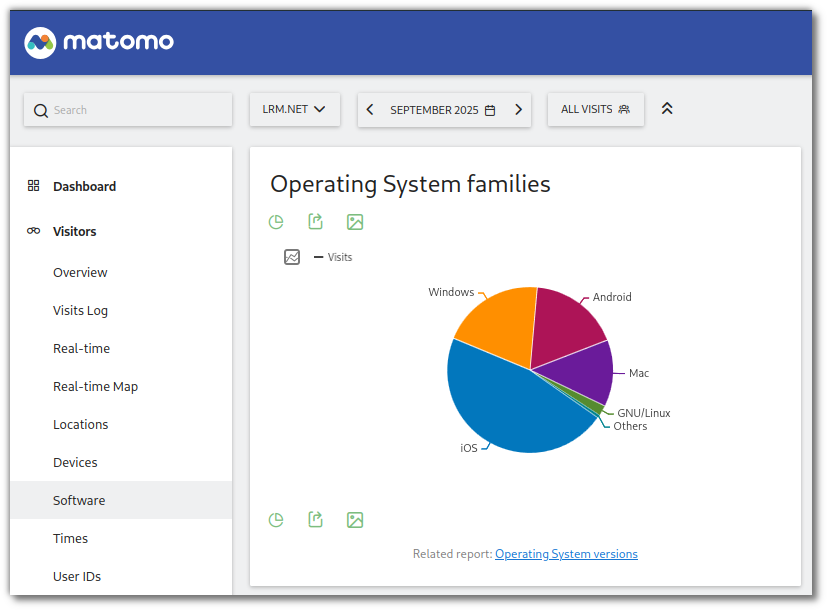
September 2025 – 2%
| Label | Visits | Actions | Unique visitors |
| iOS | 504 | 927 | 465 |
| Windows | 218 | 432 | 212 |
| Android | 192 | 353 | 185 |
| Mac | 141 | 249 | 122 |
| GNU/Linux | 22 | 51 | 22 |
| Others | 6 | 23 | 6 |
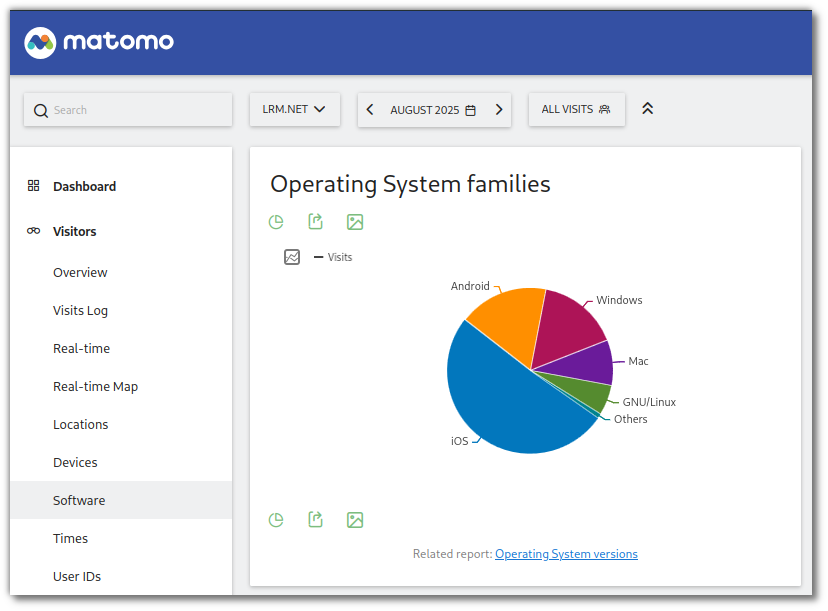
August 2025 – 6%
| Label | Visits | Actions | Unique visitors |
| iOS | 644 | 1225 | 578 |
| Android | 222 | 401 | 215 |
| Windows | 203 | 431 | 200 |
| Mac | 113 | 279 | 107 |
| GNU/Linux | 75 | 159 | 74 |
| Others | 11 | 27 | 11 |
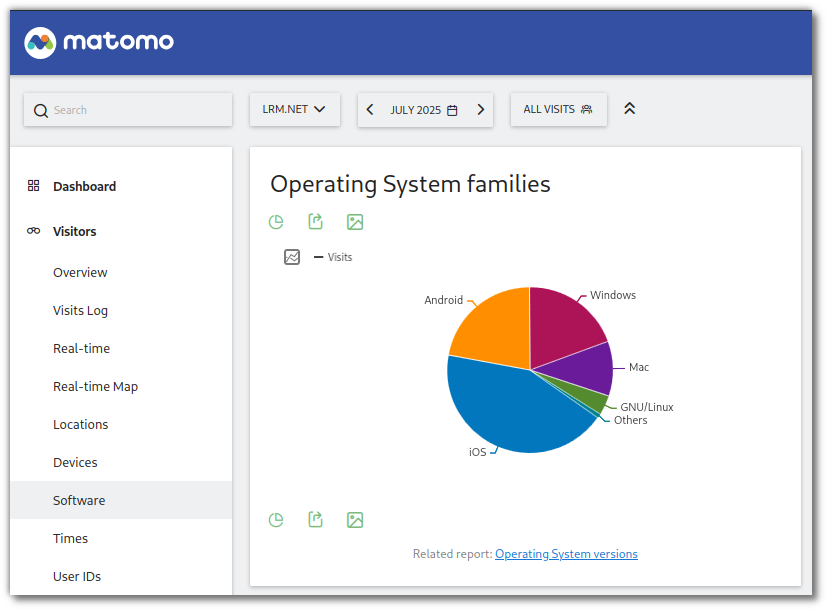
July 2025 – 4%
| Label | Visits | Actions | Unique visitors |
| iOS | 538 | 915 | 497 |
| Android | 274 | 526 | 254 |
| Windows | 243 | 444 | 236 |
| Mac | 133 | 305 | 127 |
| GNU/Linux | 48 | 107 | 46 |
| Others | 10 | 20 | 10 |
Leave a Reply